
If everything is properly set after obtaining NFPA, enable DPDK on the network interfaces you want to use for measurements.
Example:
Assume, you have 6 interfaces (4 of them are 1G NICs, while 2 of them are 10G NICs), all compatible with DPDK and you want to enable DPDK on the two 10G interfaces.
$ cd /path/to/dpdk/source
$ sudo insmod $YOUR_DPDK_TARGET/kmod/igb_uio.ko
$ sudo tools/dpdk_nic_bind.py --status
Then you will see something similar:
Network devices using DPDK-compatible driver
============================================
<none>
Network devices using kernel driver
===================================
0000:06:00.0 'I350 Gigabit Network Connection' if=eth0 drv=igb unused=igb_uio *Active*
0000:06:00.1 'I350 Gigabit Network Connection' if=eth1 drv=igb unused=igb_uio
0000:06:00.2 'I350 Gigabit Network Connection' if=eth2 drv=igb unused=igb_uio
0000:06:00.3 'I350 Gigabit Network Connection' if=eth3 drv=igb unused=igb_uio
0000:11:00.0 'Ethernet Controller X710 for 10GbE SFP+' drv=igb_uio unused=
0000:11:00.1 'Ethernet Controller X710 for 10GbE SFP+' drv=igb_uio unused=
Other network devices
=====================
<none>
$ sudo tools/dpdk_nic_bind.py --bind=igb_uio 0000:11:00.0
$ sudo tools/dpdk_nic_bind.py --bind=igb_uio 0000:11:00.1
$ cd /path/to/NFPA
$ wget http://nfpa.tmit.bme.hu/pcap/nfpa_pcaps.tar.xz
$ tar -xJvf nfpa_pcaps.tar.xz
Now, you are ready to use NFPA
UPDATE!
For the newer pcap files go to Section 5 under
Home menu to download them as compressed archives.
Option 1
In NFPA's main directory, you will find an nfpa.cfg file devoted for configuration.Edit this file with your favorite editor and set the data of your desired measurement scenario. You will find comments in the config file to ease the setup. The most important ones are packetSize, trafficType and realisticTraffic, since these properties can be used multiple times (i.e., more than one just one line in the config file). Therefore, assuming that you want to use 64-, 512-, and 1500-byte packets to be used, with traffic traces tr2e and tr3e then set these attributes as follows:
packetSize=64
packetSize=512
packetSize=1500
...
trafficType=tr2e
trafficType=tr3e
Next, assume a bit more complex scenario, when all available predefined packet sizes are wanted to be used in uni-directional setting as a simple trace, but a special tr5dl and tr5ul trace (traces generated for using different upload and download traffic) are also wanted to be used in an obvious bi-directional manner. For this, set up config file as follows:
packetSize=64
packetSize=128
packetSize=256
packetSize=512
packetSize=1024
packetSize=1280
packetSize=1500
...
trafficType=simple
trafficType=tr5dl|tr5ul
...
biDir=0
Option 2
Use the web-based GUI for setting up the scenario (scroll lower to see how NFPA needs to be started in this case)Option 1
After you configured the scenario via nfpa.cfg, go to NFPA's main root directory (if not already there)$ cd /path/to/NFPA
Then, start NFPA with the following command$ sudo python nfpa.py -n my_measurement
As can be seen, you need to specify your measurement's name that can be anything you want. It is only for easier identification under results directory (set to res/ by default).Option 2
If you want to setup NFPA via the web GUI, issue the following command$ sudo python nfpa.py -n my_measurement -w localhost:8000
After this, the web GUI can be access from localhost by entering the following URL in a browserhttp://localhost:8000/nfpa
Hovering your pointer above question marks gives more information.Starting NFPA through web GUI offers you some basic/rough estimation of the time it requires to finish, however, as indicated on that page of the GUI, always check your terminal window for further details about the actual running status.
res/ovs/kernel/intel\ xeon/virt_no/10_G/
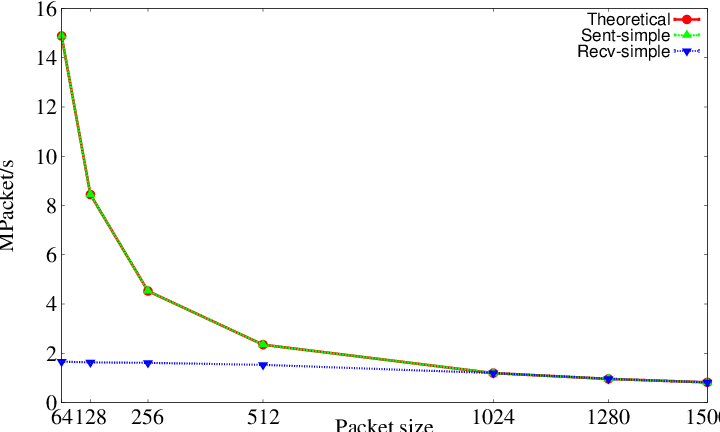
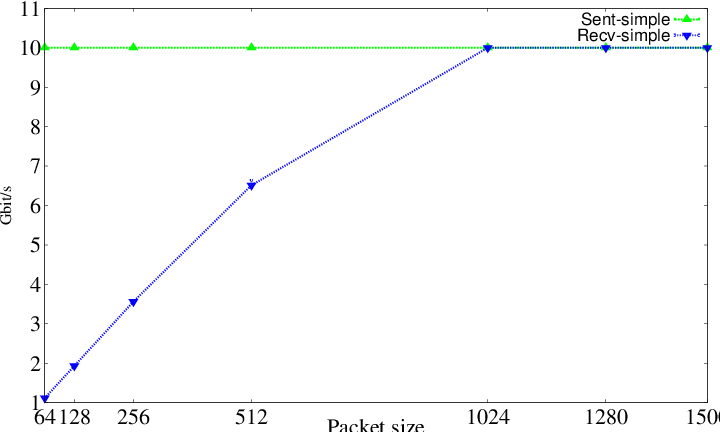
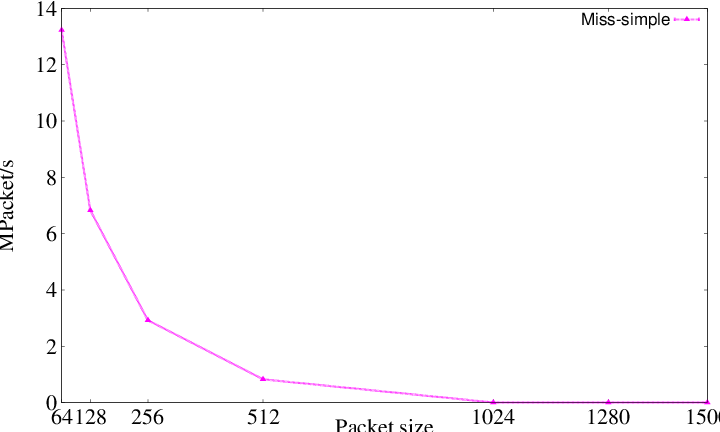
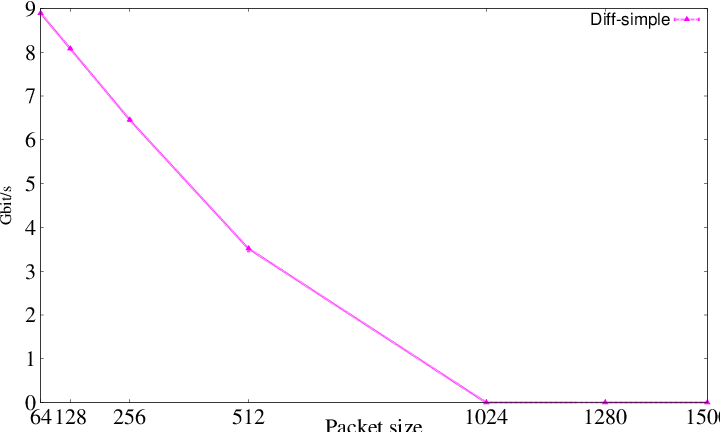
with a filename starts with my_measurement.[DIRECTION]_[TIMESTAMP].5 different files are generated for one measurement, and filenames end with:
- .data: gnuplot readable CSV file containing the measurement data
- _sent_recv_[pps_unit]pps.eps - The plot of the throughput in [pps_unit]Packet/s
- _sent_recv_[bps_unit]bps.eps - The plot of the throughput in [bps_unit]bit/s
- _miss_[pps_unit].eps - The difference between sent and received packets in [pps_unit]Packet/s
- _diff_[bps_unit].eps - The difference between sent and received packets in [bps_unit]bit/s
 |
 |
 |
 |
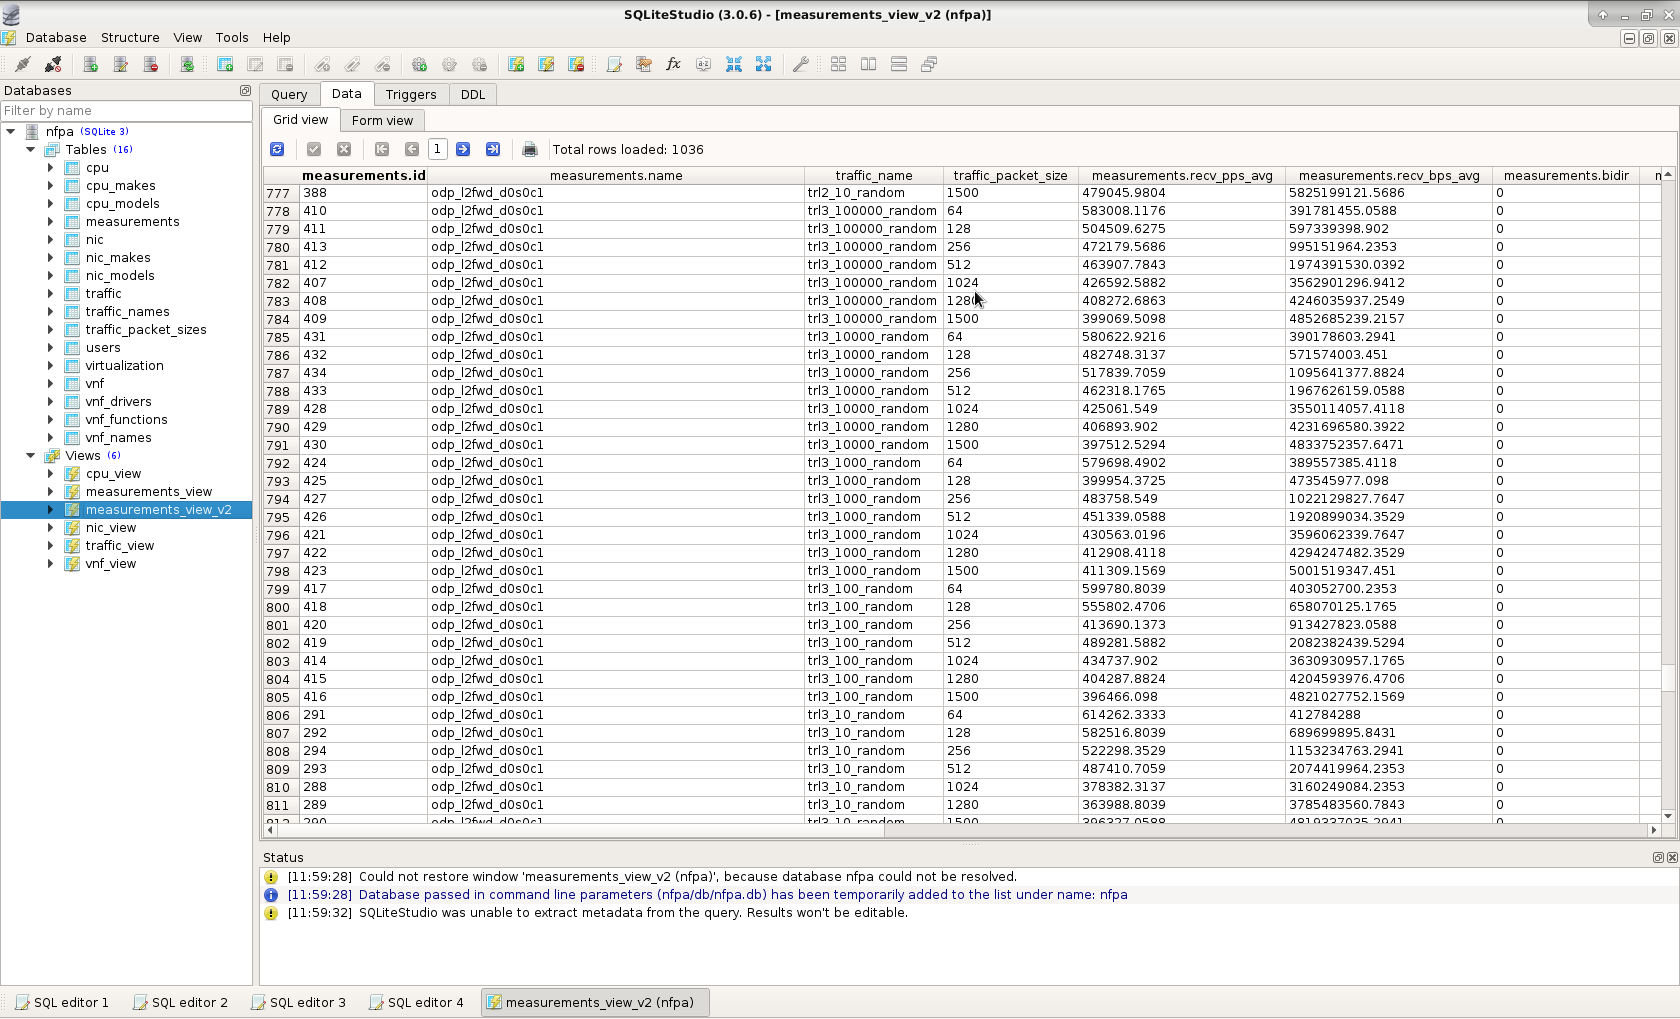
Browsing your measurements in a more detailed manner is possible through an sqlite browser application. In order to reach this end, just start your favorite sqlite browser (we prefer sqlitestudio), and load nfpa.db from the db/ directory
Simple
Note that simple traffic trace is not stored in pcap files, they are generated via Pktgen. Therefore, you can use/specify packetSize for simple trace in any size you want.
packetSize=90
packetSize=1480
...
trafficType=simple
Synthetic
In case of synthetic traffic traces - as indicated in the related comments in the config file - a pcap file needs to exist in PCAP/ directory taking into account a special naming convention. Assume you have generated your own sythetic traffic trace trMY_traffic with packet sizes 64 (trMY_traffic64.pcap) and 1500 (trMY_traffic1500.pcap) bytes, respectively. So, you have two pcap files that store your special traffictypes for the two packet sizes. In order to use it in NFPA as a synthetic traffic trace, name your two pcap files as follows:
$ mv trMY_traffic64.pcap nfpa.trMY_traffic.64bytes.pcap
$ mv trMY_traffic1500.pcap nfpa.trMY_traffic.1500bytes.pcap
$ mv nfpa.trMY_traffic.64bytes.pcap /path/to/NFPA/root/PCAP/
$ mv nfpa.trMY_traffic.1500bytes.pcap /path/to/NFPA/root/PCAP/
packetSize=64
packetSize=1500
...
trafficType=trMY_traffic
Realistic
You can also use realistic traces (stored in pcap files) as well. Realistic means that there is no restriction to packet sizes, or header information. This case is handled separately. Since different packet sizes can be in the pcap file, therefore measuring the throughput and plotting the results are made differently. So, accordingly assume that you have a pcap file named WIFI.pcap, since it was captured by your Wi-Fi router. To use this as a realistic trace, do the following steps:
$ mv WIFI.pcap nfpa.WIFI.pcap
$ mv nfpa.WIFI.pcap /path/to/NFPA/root/PCAP/
realisticTraffic=WIFI
without any packetSize parameter set. packetSize= parameter can only be set in these measurements if a correspondig synthetic traffic trace is also set.
On this page, you can browse and compare already measured and uploaded results in a really straighforward manner.
Just navigate to the corresponding site via menu, and set up your filter.
Start to fill each filter from top-left to bottom-right.
Once you set up the VNF name parameter, the site will filter out other possible filter elements that do not correspond to the selected VNF name.
And accordingly, the further filters work the same.
The Query type may be a bit ambiguous.
Selecting Normal means that if multiple measurements exist for the given filters, i.e., there are more results, for instance, for OVS with version 2.3.90,
bridge function, dpdk 2.0.0 driver, etc., then all of them will be plotted, or you can select only some of them.
The case of Maximum denotes that once the filters are set but, again, more than one result is stored in the database, then it filters out the maximal values for each
traffic trace and packetsize. This means that it is possible that the result, for instance, for 64-byte packets and 128-byte packets were measured by different users,
and different hardwares (even if their parameters are the same), or even just they come from two different measurement.
So, it shows the best results irrespectively whether they come from one certain measurement.
Furthermore, it is possible to filter only your results, by checking Only my measurements checkbox under Query type.
After you have signed up for NFPA website, you are able to upload your local sqlite database, which will be processed by our NFPA server and your results will be inserted into our database. Then you will be able to easily compare your results with other practically in no time, without making difficult manual comparisons in a sheet.
Not just you have used NFPA, but many of your colleagues? You want to share only your results, but all of you saved their measurements in the same SQLite file?
Don't worry! That's why NFPA also requires a username to be present in the local SQLite database file. Only those measurements will be shared, which are connected to the user
currently logged in at this site. Others need to be shared by the very user, who has carried out his/her measurements.
Do not change or modify the local database manually! It will definitely result in inconsistencies making it unable to be uploaded!
Since NFPA relies on many other libraries and applications, it maybe possible that during the process some problem rises. Most of the problems occur by having no permission to certain files. So in each case, always use sudo before running NFPA. A so called 'ERROR During Pktgen start' error message raises, if NFPA could not start Pktgen. This could have many reasons that are typically written to the standard output via the called application (Pktgen in this case) itself. This kind of failures should be solved manually, however, most of the cases Pktgen may not have enabled ports, or enough hugepages to carry on. Therefore, always check them.
If any further problem occurs, please send us the corresponding log file (typically found in NFPA's main root/log directory) and some other outputs that
are not present in the log file, i.e., other application/library specific error, in order to ease the spotting of the problem!
UPDATE!
Another way to get in touch with us is to subscribe for our mailing list, where your mails will
find more ears and you get response much faster.
NFPA V2 Spongebob new features
Supported soutbound APIs, scenarios, traces, etc.:
- Openflow (based on ovs-ofctl)
- For the use-case and traffic mixtures go to Use-cases
First of all, after cloning the git repository you will find an of_rules directory, where
the flow rule files describing the certain scenarios are stored with meta information about the in- and output ports.
However, right after obtaining the source code of NFPA, most of the scenarios are compressed (tar.xz)! It was necessary since
github does not allow one file to be larger than 100M, but in case of 1.000.000 flow rules, we easily violated this rule.
Thus, uncompress the archives:
$ cd path/to/nfpa/of_rules
$ for i in $(ls |grep tar.xz); do tar -xJvf $i; done
- control_nfpa: true
- control_vnf: southbound API (currently openflow only)
- control_path: path/to/control/app/ovs-ofctl
- control_args: Define here any further params, like: -O OpenFlow13 (at least this version info is needed in most of the cases)
- control_vnf_inport: port ID where packets are recieved at the VNF
- control_vnf_outport: port ID where packets are sent back to NFPA
- control_mgmt: connection data to the VNF
- vnf_function: One of the scenarios defined above, e.g., l2-switch
- trafficType: One of the traces defined above for the given vnf_function, e.g., trPR_100 (traffictraces could be downloaded from here.)
As this new feature requires the opportunity to connect to your VNF and manage it remotely, you need to ensure that your VNF accepts connections from the machine running NFPA.
In case of OVS, the easiest way to ensure this is issuing the following (or similar) command right after you started OVS:
$ sudo ovs-vsctl set-controller $your_switch_name ptcp:6634
After this, your control_mgmt parameter in nfpa.cfg should be the following under the assumption that the IP address of your VNF is 192.168.1.2:control_mgmt=tcp:192.168.1.2:6636
NFPA V3 Patrick new features
In NFPA V3 Patrick a major feature became available to make NFPA-users to be more lazy via sending email about the measurements. The emailing service itself is not part of our NFPA framework/system, it relies on your (favorite) email service, e.g., Gmail. NFPA support Pure and STARTLS security for SMTP services, others may not work. Next, configure NFPA as usual, just take into account the new configurable parts, which are the following:
- email_service: true (to indicate whether you want to use this)
- email_from: The sender email address. (Usually, the same as email_username)
- email_to: The recipient email address, where the results are sent (e.g., you@gmail.com
- email_server: The SMTP server's IP/FQDN (e.g., smtp.gmail.com)
- email_port: The SMTP server's PORT (e.g., 587)
- email_username: Your username for SMTP server (usually the same as email_from)
- email_password: Your password for SMTP server
- email_timeout: Timeout in seconds you allow for NFPA to connect to SMTP server (default: 5)
As this new feature requires the capability to connect to a (remote) SMTP server, you need to ensure that there is no firewall, which blocks this kind of traffic. The best and easiest way to check this is to issue a telnet command to the server, for instance
$ telnet smtp.gmail.com 587
If connection is successful then you should enable this feature.On the other hand, it may not cause any problem when your NFPA node is not able to communicate with the SMTP server, since that's why timeout can be defined. If the connection timeouts, then emails won't be sent, and NFPA continues its process, however each timeout makes the whole measurement to last longer.
Sponsored by:
Contact: Levente Csikor (csikor_at_tmit_bme_hu), Mark Szalay (mark.szalay_at_tmit_bme_hu), Balazs Sonkoly (sonkoly_at_tmit_bme_hu), Laszlo Toka (toka_at_tmit_bme_hu)